Where in the World Aliens Have Landed
They're out there!

Does alien life exist? The answer remains tantalizingly unclear, despite anecdotal evidence of spacecraft sightings. The “UFO Sightings around the World” dataset is modeled on the U.S.-based dataset collected by the National UFO Reporting Center. Still, the author added column headings and additional data to make it worldwide. The data records UFO sightings by the date and time, city, state or province, country, the shape of the craft in one word, the length of the encounter in seconds and a description of that “meeting,” the date it occurred, and its latitude and longitude.
1. Interactive Dashboard
For this dashboard, we can observe a heat graph on the left that depicts the amount of UFO sightings based on the country and the year documented. From the data, we can see a concentrated number of records for the US by the legend on the right-hand side. Once a user selects a data box on the left map, the right graph is a bar graph that depicts the UFO shapes of the number of records from that year and country. The heat graph is divided into the five countries with the most sightings. These are the United States, Great Britain, Germany, Canada, and Australia. It also looks like there were around 6,000 observations in both 2012-2013 and 2013-2014 in the US alone. Regardless of the year and country selected by the user, light seems to be the most popular shape for UFO observations. This makes sense because many likely see flashes of light in the night from various sources and believe they may have encountered a UFO. We used a sequential colormap for the heat graph since the intensity depends on how many sightings occur in each block.
2. Alien Sightings Throughout the World
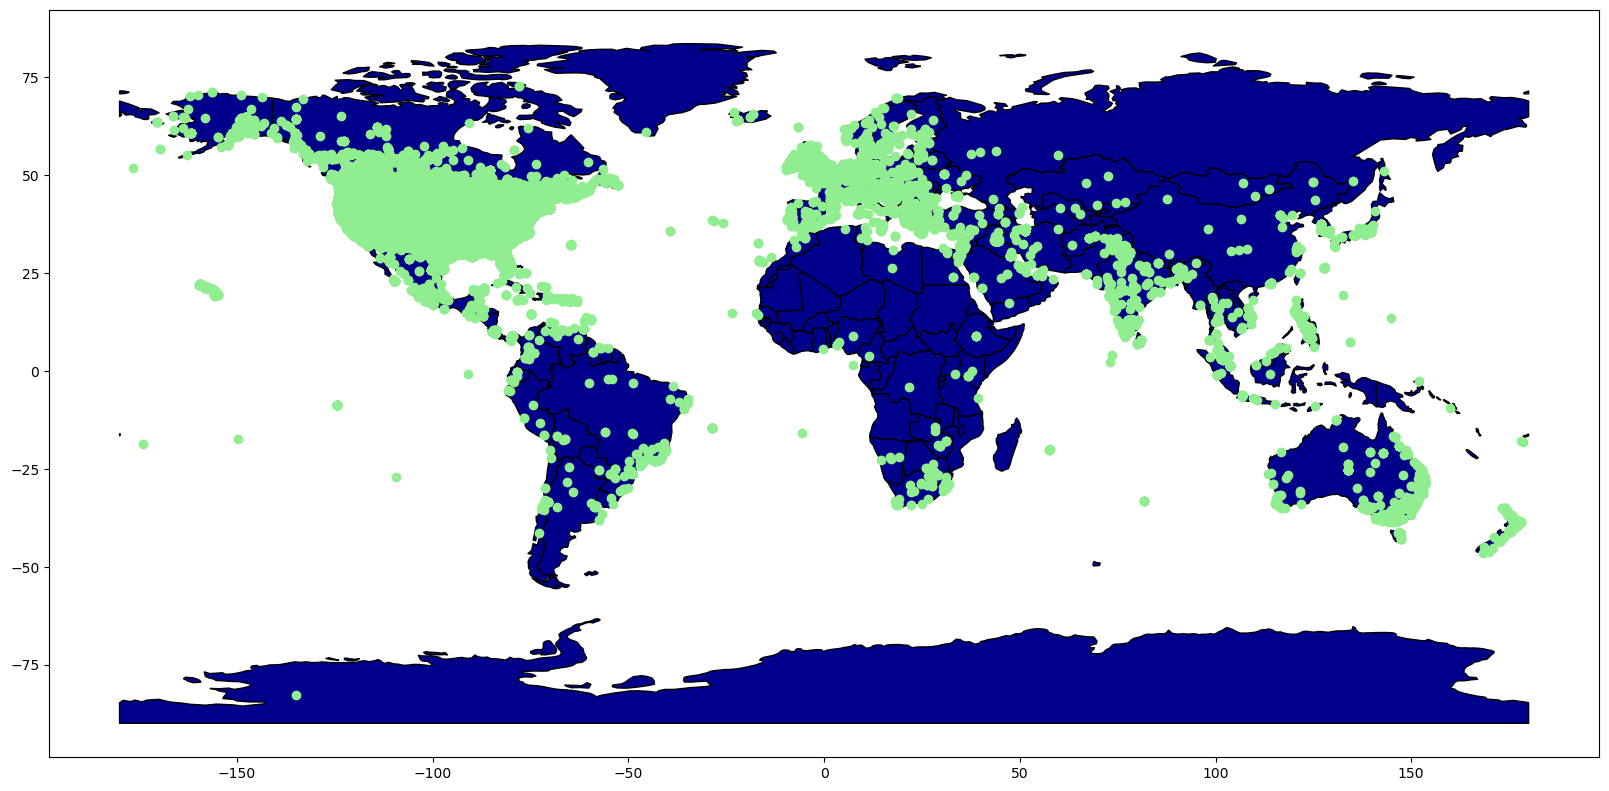
This visualization presents a world map underneath a layer of longitudes and latitudes of the observed sightings. Most of the sightings occur in the United States, and many are in western Europe. Many sightings are scattered through different regions in India and along the coasts of Australia. There are fewer sightings in Africa compared to other continents. Additionally, there is only one sighting each in both Russia and Antarctica. This is an excellent contextual visualization regarding the distribution of sightings worldwide.
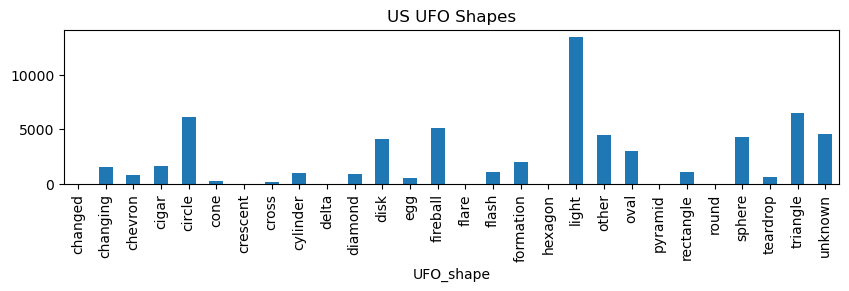
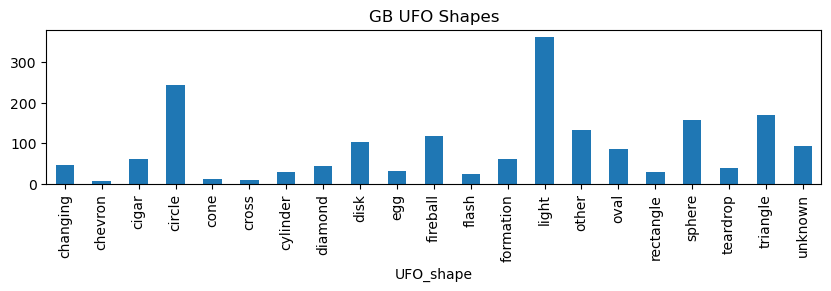
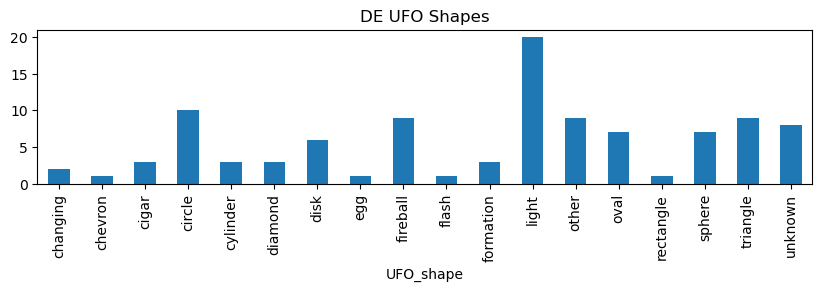
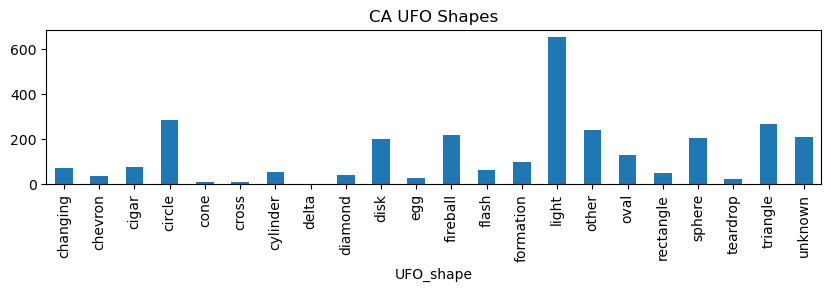
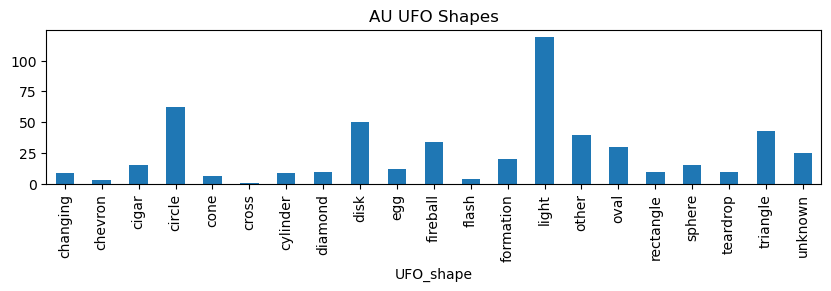
3. Shape by Country
The next section of our project takes each of the top five countries and shows the popularity of different UFO shapes for each. Once again, we can observe that the US has significantly more sightings than the other four countries based on the y-axis scale. Light is the most popular shape for all the presented countries: a circle and a triangle are next. There are also significant observations for each country where the shape is unknown or other. Another interesting thing to note is that the US and Canada are the only two countries where the delta shape was observed and that the US is the only one where the crescent shape was observed.
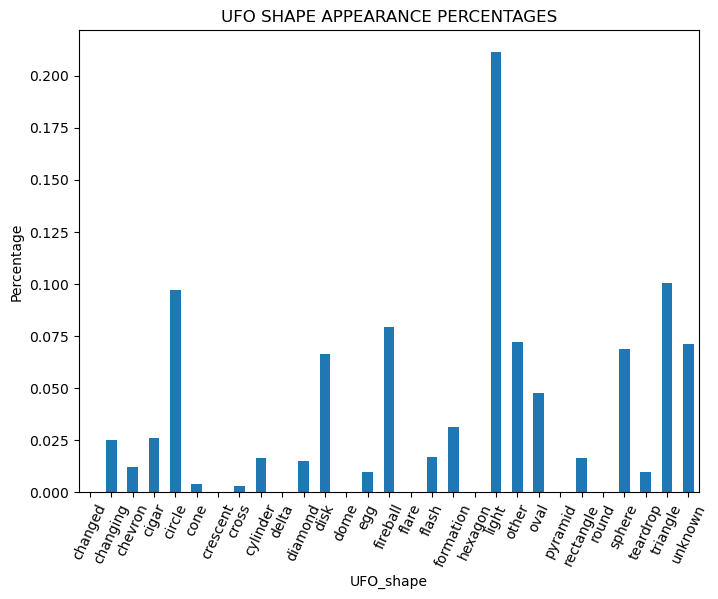
4. Thoughts on Shape
This first graph shows the percentage of shapes observed in the dataset. Lights are by far the most prominently observed shape, with just over 20% of the observations. The two most popular shapes (triangle and circle) are kept at only 10% each. Changed, crescent, delta, dome, flare, hexagon, pyramid, and round are all hardly observed. The second graph shows the US UFO shapes once more. We can see that the two graphs have very similar shapes in terms of the most and least prominent shapes. This makes sense since most of the observations are from the US.
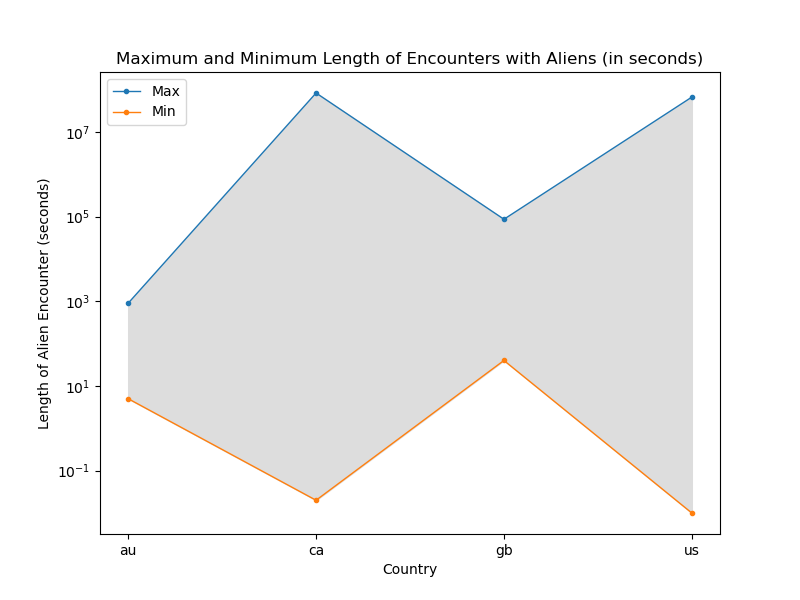
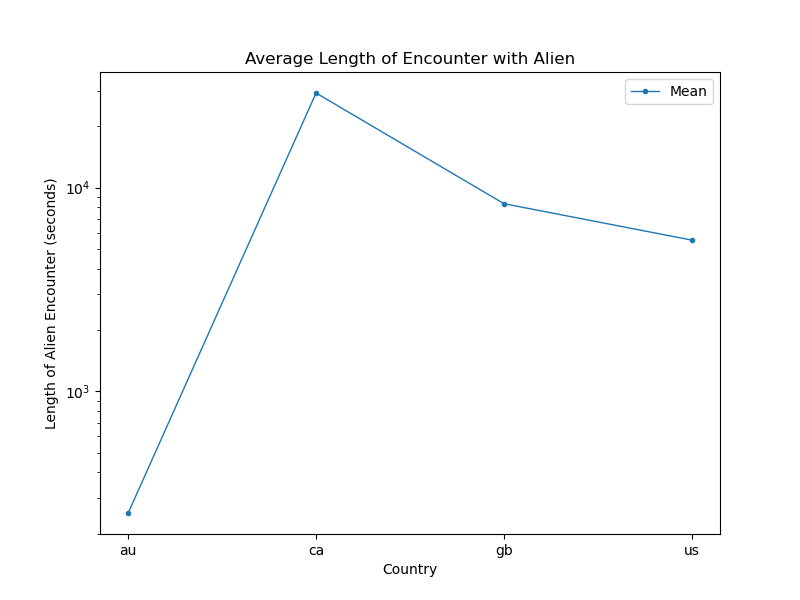
5. Length of Encounters World Wide
The last two graphs look at the length of alien encounters by country. This information is presented for Australia, Great Britain, Canada, and the United States. The United States and Canada have roughly the same maximum encounter of 10⁷ seconds. The United States has the overall minimum encounter time as well. One interesting thing of note for the second graph is that Australia has a significantly shorter average encounter time than Canada, Great Britain, and the US. Canada has the highest average encounter time among the four countries.
Sources
Naiman, Jill. Jekyll Tour Notes
Naiman, Jill. In class Jekyll resources, Week 10
Naiman, Jill. In Class Notebook, Week 11
Naiman, Jill. In class Jekyll resources, Week 12
Naiman, Jill. Prep-Notebook. Week 3. Finishing up: Visualizing Datatypes - Tabular data with Pandas
Naiman, Jill. Prep-Notebook. Week 4
USA UFO sightings (Python 3 version)
Search The Data & Methods
Below find links to both the data and the analysis code: